![]()
I. Diễn Tiến Cuộc Bầu cử Tổng Thống Hoa Kỳ năm 2012
Ngay đầu tháng Giêng năm 2012 cho tới tháng 8 đã có những buổi tranh luận [debates] nội bộ Đảng song song với những cuộc Bầu Cử Sơ Khởi [caucuses/Primary Election] tại cấp Tiểu Bang nhằm chọn lựa Ứng Cử Viên Tổng Thống cho hai Đảng Dân Chủ và Cộng Hoà.
Đảng Cộng Hoà sẽ nhóm họp Đại Hội Đảng vào những ngày 27-30 tháng 8 tại Tampa, Florida, để chọn Ứng Cử Viên Tổng Thống cho Đảng Cộng Hoà.
Đảng Dân Chủ sẽ nhóm họp Đại Hội Đảng vào những ngày 3-6 tháng 9 tại Charlotte, North Carolina, để chọn Ứng Cử Viên Tổng Thống cho Đảng Dân Chủ. Đương kim Tổng Thống Barack Hussein Obama sẽ là Ứng Cử Viên Dân Chủ, hầu như không có ai tranh giành chức vị này trong Đảng.
Sẽ có ba cuộc tranh luận giữa các Ứng Cử Viên Tổng Thống trong tháng 10 vào những ngày 3 [tại Denver, Colorado], 16 [Hempstead, New York] và 22 [Boca Raton, Florida].
Giữa các Ứng Cử Viên Phó Tổng Thống chỉ có một cuộc tranh luận duy nhất vào ngày 11 tháng 10 năm 2012.
Cuộc Bầu cử Tổng Thống thứ 57 sẽ diễn ra vào ngày 6 tháng 11 năm 2012 [Election Day/Popular vote].
Các Cử tri sẽ nhóm họp cùng một ngày 17 tháng 12 trên toàn quốc, tại viện dân biểu của từng Tiểu Bang để chính thức dồn phiếu lựa chọn Tổng Thống và Phó Tổng Thống. Cử Tri Đoàn sẽ quyết định việc chọn lựa này, căn cứ vào số phiếu của người dân đi bầu tại từng tiểu bang.
Trong cuộc bầu cử năm 2012 Cử Tri Đoàn (CTĐ) trên toàn quốc gồm có 538 cử tri (electors), ngang với tổng số nghị sĩ và dân biểu của 50 tiểu bang, cộng với 3 cử tri của District of Columbia (100 nghị sĩ +435 dân biểu+3 phiếu của D.C.). Thông thường thì ứng cử viên Tổng Thống và Phó Tổng Thống thắng cử đạt được số Phiếu Dân Bầu (popular vote) cao nhất và cũng gom được số phiếu CT tối đa, năm nay là 270 phiếu (538 CT chia đôi = 269 CT +1) trên toàn quốc.
Trong mọi trường hợp, quyết định của CTĐ [Electoral vote] là tối hậu, dù ngược lại với ý định của dân qua số Phiếu Dân Bầu (PDB/Popular vote). Đó là lý do mà lần thứ tư trong lịch sử bầu cử Tổng Thống và Phó Tổng Thống Hoa Kỳ, tại cuộc Bầu cử năm 2000, Bush được chọn làm Tổng Thống dù chỉ được ít PDB (50,456,062) trên toàn quốc, vì ứng cử viên này đã gom được 271 phiếu CTĐ, hơn số phiếu cần thiết (270) để đắc cử. Ngược lại, ứng cử viên Gore đã thua dù có số PDB cao hơn (51,003,926), nhưng chỉ gom được 266 phiếu CTĐ.
Ngày 6 tháng Giêng năm 2013, Quốc Hội chính thức đếm phiếu của Cử Tri Đoàn. Chủ Tịch Thương Viện tuyên bố kết quả cuộc Bầu Cử Tổng Thống và Phó Tổng Thống.
Ngày 20 tháng Giếng năm 2013 sẽ cử hành ngày Lễ Tấn Phong Tổng Thống và Phó Tổng Thống Hoa Kỳ.
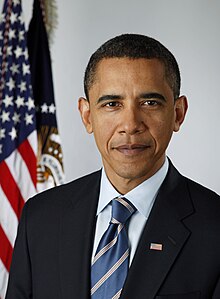
Barack Hussein Obama, 44th President of the United States
II. KHUYẾT ĐIỂM CỦA ĐƯƠNG KIM TỔNG THỐNG BARACK HUSSEIN OBAMA TRONG DỰ TÍNH TÁI ỨNG CỬ
Trong tuần lễ từ 11 tới 16 tháng giêng năm 2012, Trung Tâm Điều Nghiên Pew Research Center, dưới sự điều động của Princeton Survey Research Associates International, đã phỏng vấn qua điện thoại 1,502 công dân từ 18 tuổi trở lên, sinh sống tại 50 Tiểu Bang và Thủ Đô Hoa Kỳ — District of Columbia, trong đó có 370 thuộc Đảng Cộng Hoà, 468 thuộc Đảng Dân Chủ và số còn lại là 586 độc lập, không theo bất cứ đảng nào.

Pew Research Center Jan. 11-16, 2012
Công việc tham khảo ý dân này nhằm mục đích khảo sát và đo lường thành quả — ưu và khuyết điểm — trong nhiệm kỳ đầu của TT Obama. Chúng ta hãy tạm dùng thuật ngữ “Tổng số Tham khảo” hay “Tổng số Trắc nghiệm” để chỉ định nhóm 1,502 mẫu dân đa dạng, đa nguyên được chọn trong việc thăm dò trên.
Do đó, cuộc tham khảo hay phỏng vấn trắc nghiệm vô tư, không phân biệt sắc tộc, giới tính, tuổi tác của các đương sự được thăm dò, đã đem lại những kết quả thẩm định như sau liên hệ tới nhiệm kỳ đầu của Tổng Thống Barack Hussein Obama:
1. TT Obama với Công Trạng Hành pháp bị đánh giá thấp

Bước vào năm thứ tư nhiệm kỳ đầu, TT Obama chỉ được 44% tổng số tham khảo tán thành [approve], còn 48% không tán thành [disappove] về công trạng hành pháp [overall job rating] tới nay. So với các Tổng Thống tiền nhiệm [Bush cha, Clinton, Bush con] Obama khởi đầu năm chuẩn bị tái ứng cử thua kém nhất.
Chúng ta cũng thấy công trạng hành pháp của TT Obama chỉ được 37% tổng số tham khảo công dân độc lập tán thành, trong khi tỷ lệ thành phần độc lập không tán thành lến tới 56%, cao hơn số dân chê trách TT George H. W. Bush trong cùng giai đoạn tái ứng cử liên hệ.

Căn cứ vào bản so sánh trên, 32% tổng số tham khảo nghĩ rằng TT Obama về đường dài sẽ thất bại, trong khi 27% đoán rằng ông ta sẽ thành công [long-term achievements]. Số còn lại là 39% thì cho rằng qua sớm để khẳng định một cách rõ rệt.
Diễn tiến hay thay đổi thái độ của công dân độc lập chưa cam kết sẽ đem lại nhiều bất ngờ vào giờ phút chót trong cuộc bầu cử Tổng Thống Hoa Kỳ năm 2012.
2. Ý Dân Tiêu Cực Trước Những Vấn Nạn Quốc Nội [Domestic Issues]


- Đến giờ phút này, chỉ còn có 38% tổng số trắc nghiệm tán thành việc quản trị về mặt kinh tế [handling the economy] của chính phủ Obama trong khi thành phần không tán thành lên tới 59% tổng số trắc nghiệm, căn cứ vào tình trạng suy thoái kinh tế còn trầm trọng.
- Chủ trương thâm hụt ngân sách quốc gia [federal budget deficit] của TT Obama chỉ được 34% tổng số trắc nghiệm tán thành trong khi thành phần chống đối lên tới tỷ lệ 62% tổng số trắc nghiệm. Phản ứng tiêu cực này gia tăng gần 10% so với những năm trước.
- Chính sách bảo vệ môi trường [environment protection] và phân phối năng lượng [energy policy] của chính phủ Obama gặp sự phản đối với tỷ lệ 46% tổng số trắc nghiệm, căn cứ vào phản ứng chung của dân chống việc chính phủ Obama cho phép nhập cảng dầu thô lấy từ mỏ dầu cát lộ thiên bên Canada chuyển sang Hoa Kỳ qua hệ thống ống dẫn dầu của Hệ thống Keystone XL oil pipeline. Công tác chuyển nhập dầu thô này có thể gây thêm tình trạng ô nhiễm môi trường quốc nội.
- Chính sách y tế [healthcare] của Obama gặp sự phản đối với tỷ lệ 58 % trong khi sự tán thành chỉ lên tới tỷ số 40% tổng số trắc nghiệm.
- Chính sách giáo dục [education] của Obama gặp sự phản đối với tỷ lệ 61 % tổng số trắc nghiệm.
- Chính sách đương đầu với nạn thất nghiệp [unemployment] của Obama gặp sự phản đối với tỷ lệ 53 % trong khi sự tán thành chỉ lên tới tỷ số 45% tổng số trắc nghiệm.
- Chính sách đương đầu với nạn di dân bất hợp pháp [illegal immigration] y tế của Obama gặp sự phản đối với tỷ lệ 56 % trong khi sự tán thành chỉ lên tới tỷ số 37% tổng số trắc nghiệm.
III. ƯU ĐIỂM CỦA ĐƯƠNG KIM TỔNG THỐNG BARACK HUSSEIN OBAMA TRONG DỰ TÍNH TÁI ỨNG CỬ
1. Ấn Tượng về Tư Cách Cá Nhân và Tư Duy Chính Trị của TT Obama vẫn cao
- Đa số thành phần được tham khảo nghĩ rằng TT Obama thật tâm tin tưởng vào đường lối cai trị của ông ta [75%]; biết lo lắng cho dân [61%]; đáng tin cậy [61%]; hoạt bát [78%], thân thiện [71%] và thông thạo thời cuộc [69%].
- TT Obama vẫn được coi là một lãnh tụ cương quyết [52%] dù công trạng hành pháp không mấy toàn hảo.
2. Ưu Điểm về Chính sách Đối ngoại của TT Obama


- Tới đầu năm 2012, chính sách đối ngoại toàn diện của TT Obama được 48% dân chúng tán thành cao, với 45% chống đối.
- Đặc biệt 65% tổng số tham khảo tán thành đường lối Hoa Kỳ đương đầu với vấn nạn khủng bố trên toàn thế giới. Tỷ lệ này đã tăng 10% so với tỷ lệ đạt trong năm 2011. Riêng ngay sau khi Osama bin Laden bị hạ sát vào tháng 5 năm 2011, tỷ lể tán thành đã vọt hẳn lên tới 69%.
- 56% tổng số tham khảo tán thành đường lối giao tranh tại Afghanistan, nhất là nhờ vào sự kiện Hải Quân SEAL thủ tiêu Osama bin Laden tại Abbottabad, Pakistan. Tỷ lệ chống đối mặt trận Afghanistan chỉ ở tỷ lệ 37%.
- Đồng thời 48% tổng số tham khảo cũng tán thành việc Hoa Kỳ đương đầu với Iran, so với tỷ lệ chống đối là 41%.
3. Cảm tình Dân Chúng dành cho vợ chồng TT Obama, PTT Biden và Ngoại Trưởng Hilary Rodham Clinton


- Căn cứ vào bản so sánh trên, PTT Joe Biden đã mất phần nào cảm tình của dân chúng ngay từ năm thứ 2 nhiệm kỳ đầu, trong khi Ngoại Trưởng Hillary Rodman Clinton lại dành được sự ủng hộ cao của dân chúng, với tỷ lệ 62% tổng số tham khảo gần đây. Bà Clinton đã gây dựng uy tín từ khi Bộ Ngoại Gia Hoa Kỳ ứng dụng quyền lực mềm nhằm ủng hộ cuộc nổi dậy của dân Ả Rập tại Trung Đông và Bắc Phi, cũng như chuẩn bị hợp tác quy mô với các lực lượng chính yếu tại Khu vực Châu Á Thái Bình Dương.
- Cuộc thăm dò trên cũng cho thấy Đệ Nhất Phu Nhân Michelle Obama vẫn giữ được cảm tình của dân chúng ở tỷ lệ 66% tổng số tham khảo, trong khi tỷ lệ chống đối lên tới 21%.
- Như vậy những lực lượng nội thuộc, các cộng sự viên của TT Obama có khuynh hướng giúp đương kim Tổng Thống hơn là làm trở ngại trong nỗ lực tái ứng cử của ông ta.
- Chúng ta sẽ không ngạc nhiên nếu thấy Obama chọn Hillary Rodham Clinton làm ứng cử viên Phó Tổng Thống, thay thế Joe Biden. Nếu cặp Obama-Clinton thắng trong cuộc bầu cử 2012, vị Phó Tổng Thống tương lai này sẽ là đương kim ưng cử viên Tổng Thống nhiệm kỳ 2016-2020. Nếu Clinton thắng, Đảng Dân Chủ sẽ có triển vọng nắm chính quyền từ 12 tới 16 năm liên tục. Hiện tượng này đáng mừng hay đáng e ngại cho toàn thể chính cục Hoa Kỳ?
IV. ƯU VÀ KHUYẾT ĐIỂM CỦA ỨNG CỬ VIÊN CỘNG HOÀ
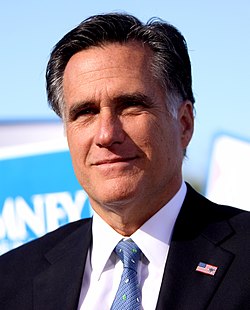
Mitt Romney, 70th Governor of Massachusetts

Tới giờ phút này, Romney nhận được 31% tổng số ủng hộ của cử tri Cộng Hoà, trong khi Newt Gingrich được 16%, Ron Paul 15%, Rick Santorum 14% và Rick Perry 5%.

Tuy nhiên, Romney vẫn được 61% tổng số cử tri Cộng Hoà ưa chuộng, cũng như sự tán thành của 59% nhóm Chống Thuế Tea Party và 52% của cộng đồng Tin Lành Da trắng, hệ phái Phúc Âm [Evangelical Protestant], dù Romney theo tín ngưỡng “Mormon” của hệ phái The Church of Jesus Christ of Latter-day Saints.
Tôn giáo này có phần chống lại Thiên Chúa giáo và tán thành hệ thống đa thê. Đó là lý do đa số người dân Hoa Kỳ theo Tin lành coi đạo “Mormon” là một giáo phái mê tín không chính thống. Đó cũng là lý do mà Romney không được nhiều cảm tình của toàn quốc. Romney cần tìm cách xoá bỏ “thành kiến tôn giáo này” nơi quần chúng để khai dựng hình ảnh của một lãnh tụ quốc gia được đa số dân chúng yêu chuộng.
3. Triển Vọng Thắng Obama theo thẩm định của Đảng Cộng Hoà

- Trong số dân chúng ghi tên đi bầu theo danh sách đảng Cộng Hoà, 58% cho rằng Romney sẽ thắng Obama, chỉ có 11% nghĩ rằng Gingrich là ứng cử viên kế tiếp có triển vọng thắng đương kim Tổng Thống.
- 33% cử tri Cộng Hoà cho rằng Romney có khả năng gây thêm công ăn việc làm [job opportunity] cho dân, hơn là tin vào Paul[14%] và Gingrich [12%]; 29% tin Romney có thể giảm bớt thâm hụt ngân sách quốc gia [federal budget deficit] hơn là Gingrich [20%] và Paul [19%].
- Về diện xã hội [như phá thai], lập trường bảo thủ của Santorum được cự tri Cộng Hoà tán thành hơn đối với Romney.
- Về chính sách đối ngoại, cử tri Cộng Hoà tin Gingrich [33%] vượt khả năng của Romney [25%]. Như vậy, ứng cử viên Romney sẽ ở thế yêu kém hơn Obama về chính sách đối ngoại.

- Đầu năm 2012, 50% của TSDGD-BTT tuyên bố sẽ bầu cho Obama và 45% dành phiếu cho Romney. Trong tháng 10 năm 2011, cả hai ứng cử viên điển hình này được dân chúng lựa chọn ngang nhau [48%/48%].
- Riêng Ron Paul hứa không tranh cử bằng đương lối “Đảng Thứ Ba” [third-party campaign]. Nhưng nếu vào giờ phút chót Ron Paul thay đổi ý kiến, thì thắng lợi sẽ nghiêng hẳn về Obama [44%], còn Romney chỉ được 32% khi Paul giành mất 18% số phiếu do công dân độc lập dồn lại.
V. HAI HOẠT CẢNH ĐIỂN HÌNH
1. Nếu trong năm 2012 nền kinh tế tiếp tục suy thoái
- Tổng sản phẩm nội địa không tăng trưởng [GDP growth 0%];
- Triển vọng thắng cử qua số phiếu dân bầu [popular vote] của Romney sẽ là 83%;
- Trong khi Obama chỉ còn hy vọng thắng là 17%.
2. Nhưng nếu trong năm 2012 nền kinh tế tái phát
- Trường hợp Tổng sản phẩm nội địa tăng trưởng từ 2 tới 4%;
- Triển vọng thắng cử qua số phiếu dân bầu [popular vote] của Obama sẽ là 60%;
- Trong khi Romney chỉ còn hy vọng thắng là 40%.
- Nhưng Romney sẵn sảng chống đối “hiện tượng hư ảo” này bằng cách chứng minh rằng nền kinh tế phát triển quá ít và quá muộn.
- Do đó, nếu Obama có thắng, thì cũng chỉ thắng chút ít, không ồ ạt như cuộc thắng thế của Romney trong hoạt cảnh [1].
TẠM KẾT LUẬN
Đối với người dân đi bầu [popular vote] vấn đề chủ chốt trong cuộc bầu cử Tổng Trong năm 2012 đặt trọng tâm vào tình hình quốc nội, nhất là tình trạng di căn của nền kinh tế rất bấp bênh và cơ hội công ăn việc làm của người dân [thành phần đi bầu] còn gặp nhiều khó khăn.
Kết quả dân bầu [popular vote] tuy không trực tiếp quyết định sự thắng cử của vị Tổng Thống Hoa Kỳ, nhưng lại ảnh hưởng tới quyết định lựa chọn Tổng Thống của Cử Tri Đoàn tại cấp địa phương, ở mỗi Tiểu Bang.
Vậy sự hấp dẫn trên hứa hẹn kinh bang tế thế của Romney chỉ thực sự hữu hiệu nếu tình trạng kinh tế tại Hoa Kỳ điển hình suy thoái, không thể ngóc đầu lên nổi trong năm 2012.
Nhưng nếu bỗng nhiên đời sống có bề dễ thở hơn, nếu nền kinh tế phồn thịnh trở lại trong năm 2012, đó là cái may của cả dân tộc Hoa Kỳ và cũng là cái hên mầu nhiệm của Obama vậy.
Sau đó cái gì sẽ tới ắt phải tới: từ sự vẫy vùng phồn thịnh tạm bợ hay giả tạo sẽ có một chu kỳ dấu ấn Đảng Dân Chủ kéo dài, với thêm gánh nặng hành chính cho các dự án mới, thêm thử thách táo bạo hay nghiệt ngã, thêm nợ nần, tư cũng như công.
Bên cạnh cái may — nếu có — của năm 2012 cho một số người dân Hoa Kỳ cũng có thể phát hiện cái xui của cả một thập kỷ tiếp đó cho rất nhiều người dân khác trong nước. Nhưng tương lai của Hoa Kỳ vẫn sáng sủa, vẫn còn hy vọng tự tại, vì tai ương chính trị, kinh tế xã hội sẽ tự nó khai trừ hay giải toả sau mỗi chu kỳ thử thách quản trị đất nước. Cái sai tự nó phải lùi bước, nhường chỗ cho cái đúng, cái phải. Đó là điểm son của chính thể tự do dân chủ, xây dựng trên căn bản pháp trị tự chỉnh, tự duy, mà cứu cánh là quyền lợi chính đáng của người dân.
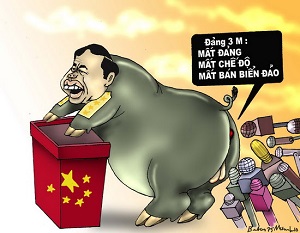
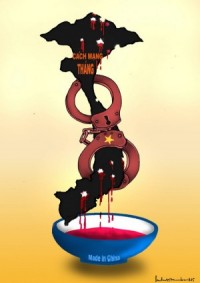
Khác hẳn với chế độ cộng sản chuyên chính độc đảng toàn trị, đặt trên căn bản duy nhất là quyền lợi bá đạo của Đảng — một thế lực quan lại ngược đời, vừa ngoan cố tàn bạo, vừa mù quáng lỗi thời, mà định luật kết thúc, mãn hạn sẽ là sự tự hủy nội tại hay tự nổ tất nhiên. Trung Quốc, Việt Nam và Bắc Triều Tiên đang ở thế mấp mé tự hủy và tự banh nổ này.
Đăng lần đầu Jan 26, 2012 — Đăng lại May 29, 2012
TS-LS LƯU NGUYỄN ĐẠT


5 Comments
Long Hoang
Anh Đạt kính,
Cám ơn Anh Đạt đã cho đọc một tổng hợp nhận định về cuộc bầu cử Tổng thống Hoa Kỳ năm 2012. Gọi là nhận định thì không chính xác mà gọi là một tổng hợp thì cũng sai. Tôi nghĩ cứ tạm gọi là một nhận định tổng hợp. Tuy nhiên vô cùng thích thú với lối trình bầy vấn đề cũa Anh.
Có lẽ cũng vô cùng thích thú nếu chúng ta thử luận về “sác xuất” của những cuộc thăm dò (survey), cho rằng thêm cà một giới hãn sai số + và -. Sác xuất hay chính xác có thể được kiễm chứng bằng câu “nếu cuộc bầu bán được thực hiện ngay hôm nay”. Nhưng sự kiểm chứng này chẳng thể có.
Tính chính xác của thăm dò cũng tùy thuộc vào đối tượng được thăm dò. Kết quả cuộc thăm dò không biết có dẩn dắt toàn thể cử tri, và nếu cử tri còn có những thành phần ngoài thành phần được phân loại đặt tên.
Xin có vài hàng ý kiến, kính chúc Anh Chị và các cháu năm mới Nhâm Thìn luôn hưởng an lạc, hạnh phúc.
Hoàng Cơ Long
joseph Vu
Nghien cuu cong phu, nhung tai lieu thong ke da thay doi qua nhieu trong 10 ngay qua : N. Gingrich dang tren da thang the, nghieng ngua voi M. Romney.
TS.LS Lưu Nguyễn Đạt
Xin đa tạ Quý Vị đã hồi âm. Tôi xin phép chuyển những nhận định của Quý Vị vào phần Bình luận/Comment nơi cuối bài viết.
Tôi có ghi rõ — các phân tích và dự đoán trong bài đa số căn cứ vào những so sánh tham khảo của Survey trong tuần lễ 11 tới 16 tháng giêng năm 2012 của Trung Tâm Điều Nghiên Pew Research Center. Sự sai lệch biên tế [margin of error] “thêm/bớt” của các “surveys” đều theo một tiêu chuẩn đồng đều, nên sự chính xác tuy có căn bản khoa học nhưng vẫn có tính cách ước lượng, do đó sự tiến hoá của cuộc Bầu Cử còn tùy thuộc vào yếu tố thời gian, điều kiện hội nhập và phản ứng giữa các đối tác liên hệ.
Bài viết này chỉ có tính cách phân tích và để cử một số nhận định để người viết và độc giả có cơ hội suy luận và bổ túc thêm.
Trong bài tôi cũng nói tới những cơ hội/hoạt cảnh/options/scénarios/ để từ đó so sánh các hậu quả khác nhau.
Chúng ta sẽ có dịp bổ túc và cập nhật những nhận định sơ khởi này. Xin đa tạ. Lưu Nguyễn Đạt
Sample Size Calculator Terms: Confidence Interval & Confidence Level
The confidence interval (also called margin of error) is the plus-or-minus figure usually reported in newspaper or television opinion poll results. For example, if you use a confidence interval of 4 and 47% percent of your sample picks an answer you can be “sure” that if you had asked the question of the entire relevant population between 43% (47-4) and 51% (47+4) would have picked that answer.
The confidence level tells you how sure you can be. It is expressed as a percentage and represents how often the true percentage of the population who would pick an answer lies within the confidence interval. The 95% confidence level means you can be 95% certain; the 99% confidence level means you can be 99% certain. Most researchers use the 95% confidence level.
When you put the confidence level and the confidence interval together, you can say that you are 95% sure that the true percentage of the population is between 43% and 51%. The wider the confidence interval you are willing to accept, the more certain you can be that the whole population answers would be within that range.
For example, if you asked a sample of 1000 people in a city which brand of cola they preferred, and 60% said Brand A, you can be very certain that between 40 and 80% of all the people in the city actually do prefer that brand, but you cannot be so sure that between 59 and 61% of the people in the city prefer the brand.
Factors that Affect Confidence Intervals
There are three factors that determine the size of the confidence interval for a given confidence level:
Sample size
Percentage
Population size
Sample Size
The larger your sample size, the more sure you can be that their answers truly reflect the population. This indicates that for a given confidence level, the larger your sample size, the smaller your confidence interval. However, the relationship is not linear (i.e., doubling the sample size does not halve the confidence interval).
Percentage
Your accuracy also depends on the percentage of your sample that picks a particular answer. If 99% of your sample said “Yes” and 1% said “No,” the chances of error are remote, irrespective of sample size. However, if the percentages are 51% and 49% the chances of error are much greater. It is easier to be sure of extreme answers than of middle-of-the-road ones.
When determining the sample size needed for a given level of accuracy you must use the worst case percentage (50%). You should also use this percentage if you want to determine a general level of accuracy for a sample you already have. To determine the confidence interval for a specific answer your sample has given, you can use the percentage picking that answer and get a smaller interval.
Population Size
How many people are there in the group your sample represents? This may be the number of people in a city you are studying, the number of people who buy new cars, etc. Often you may not know the exact population size. This is not a problem. The mathematics of probability proves the size of the population is irrelevant unless the size of the sample exceeds a few percent of the total population you are examining. This means that a sample of 500 people is equally useful in examining the opinions of a state of 15,000,000 as it would a city of 100,000. For this reason, The Survey System ignores the population size when it is “large” or unknown. Population size is only likely to be a factor when you work with a relatively small and known group of people (e.g., the members of an association).
The confidence interval calculations assume you have a genuine random sample of the relevant population. If your sample is not truly random, you cannot rely on the intervals. Non-random samples usually result from some flaw in the sampling procedure. An example of such a flaw is to only call people during the day and miss almost everyone who works. For most purposes, the non-working population cannot be assumed to accurately represent the entire (working and non-working) population…
tan-hong nguyen
Xin cảm ơn LS.
Một bài khảo cứu rất công phu.
Thân kính,
Nguyễn Tấn-Hồng
JoTony Pham-Vu
Cảm ơn rất nhiều vì bài tham khảo rất có giá trị ! Xin tiếp tục viết đại loại như thế, để cử tri Việt có cái nhìn cụ thể trước khi đi bầu. Xin gửi lời chào trân trọng tối tác giả.